Beberapa waktu lalu iseng-iseng ingin membuat grafik untuk keperluan kerjaan, sempat mikir buat pakai fusionchart (grafik berbasis flash berlisensi alias bayar). Waktu tugas kuliah pernah pake fusionchart, lumayan mudah menggunakannya tapi gw hindarin sesuatu yang berbasis flash (except youtube, mdh2an nanti ga berbasis flash :D) karna flash ternyata kurang bagus dan banyak makan resource CPU ampe bikin PC hang *curhat* gmn klo smartphone, bisa meledak *lebay dan kebetulan library d3js gratis seperti library reveal.js yang saya gunakan untuk mengganti powerpoint.
Seperti biasa siapa lagi yang ditanya klo bukan ke mbah gugel. Sempat nyoba beberapa seperti Chart.Js bagus sih tapi terlalu simpel kurang interaktif dan kurang greget gitu,hehe..
Akhirnya ketemu sama 1 library javascript yaitu D3.js menurut keterangan websitenya :
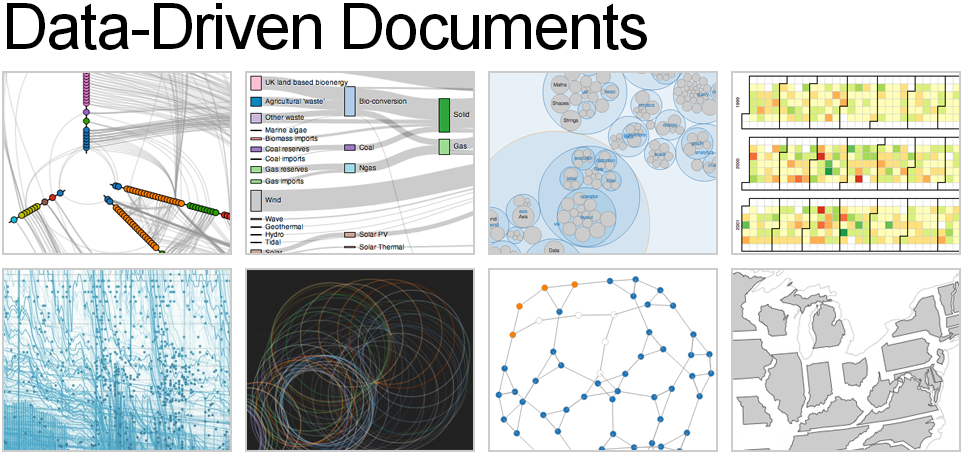
D3.js is a JavaScript library for manipulating documents based on data. D3 helps you bring data to life using HTML, SVG and CSS. D3’s emphasis on web standards gives you the full capabilities of modern browsers without tying yourself to a proprietary framework, combining powerful visualization components and a data-driven approach to DOM manipulation.
Yes this is what i want! Terlebih saat melihat contoh-contoh grafiknya, banyak sekali, menantang dan cukup gereget lihatnya. Sehingga pilihan hati gw jatuh kepada d3.js :D, tapi cinta tetep buat si pacar *lho*.
D3.js menggunakan syntax SVG dalam HTML dan mendukung banyak browser desktop bahkan mobile, berikut link tabel-tabel terhadap dukungan SVG pada HTML. Pertama nyoba sih agak susah, tapi dari contoh-contohnya cukup mudah kebetulan saya hanya menggunakan Basic Chart saja.
Line Chart menggunakan data dari format JSON :
1
2
3
4
5
6
7
8
9
10
11
12
13
14
15
16
17
18
19
20
21
22
23
24
25
26
27
28
29
30
31
32
33
34
35
36
37
38
39
40
41
42
43
44
45
46
47
48
49
50
51
52
53
54
55
56
57
58
59
60
61
62
63
64
65
66
67
68
69
70
71
72
73
74
75
76
77
78
79
80
81
82
83
84
85
86
87
88
89
90
91
92
93
94
95
96
97
98
99
100
101
102
103
104
105
106
107
108
109
110
111
112
113
114
115
116
117
118
119
120
121
122
123
124
125
126
127
128
129
130
131
132
133
134
135
136
137
138
139
<meta charset="utf-8">
<style>

body {

font: 10px sans-serif;

}

.axis path,

.axis line {

fill: none;

stroke: #000;

shape-rendering: crispEdges;

}

.x.axis path {

display: none;

}

.line {

fill: none;

stroke: steelblue;

stroke-width: 1.5px;

}

</style>

<body>

<script src="d3.js"></script>

<script>

var margin = {top: 20, right: 20, bottom: 30, left: 50},

width = 960 - margin.left - margin.right,

height = 500 - margin.top - margin.bottom;

var parseDate = d3.time.format("%d-%b-%y").parse;

var x = d3.time.scale()

.range([0, width]);

var y = d3.scale.linear()

.range([height, 0]);

var xAxis = d3.svg.axis()

.scale(x)

.orient("bottom");

var yAxis = d3.svg.axis()

.scale(y)

.orient("left");

var line = d3.svg.line()

.x(function(d) { return x(d.date); })

.y(function(d) { return y(d.close); });

var svg = d3.select("body").append("svg")

.attr("width", width + margin.left + margin.right)

.attr("height", height + margin.top + margin.bottom)

.append("g")

.attr("transform", "translate(" + margin.left + "," + margin.top + ")");

d3.json("data.json", function(error, data) {

data.forEach(function(d) {

d.date = parseDate(d.date);

d.close = +d.close;

});

x.domain(d3.extent(data, function(d) { return d.date; }));

y.domain(d3.extent(data, function(d) { return d.close; }));

svg.append("g")

.attr("class", "x axis")

.attr("transform", "translate(0," + height + ")")

.call(xAxis);

svg.append("g")

.attr("class", "y axis")

.call(yAxis)

.append("text")

.attr("transform", "rotate(-90)")

.attr("y", 6)

.attr("dy", ".71em")

.style("text-anchor", "end")

.text("Price ($)");

svg.append("path")

.datum(data)

.attr("class", "line")

.att</pre>line);

});
</script>
Hasilnya

beberapa troubleshooting yg pernah saya dapatkan adalah pada format date, php menghasilkan timestamp sedangkan d3.js menggunakan unix epoch (unix epoch = timestamp * 1000).
Dilain kesempatan grafik akan dibuat lebih interaktif.
See ya..